Top-Up Screen A/B Testing

Company
PayPay
Industry
Fintech
Timeline
2025/2 - 2025/6
Responsibility
End-to-end design process
Prototyping
Overview
Every PayPay top-up comes with a processing fee. At millions of transactions a month, that adds up fast.
I noticed users kept topping up in small amounts, around ¥5,000 multiple times a month, instead of loading a larger amount once. I dug into past research and data to understand why, formed a hypothesis on how to encourage larger top-ups and reduce frequency, and ran a one-month A/B test to validate it.
0
0
%↑
Top-up amount
0
0
%↓
Cost of top-up
Start with the problem
Each small top-up carried its own processing fee, and at PayPay's transaction volume those fees added up to tens of millions of yen every month. Fewer, larger top-ups would help both sides: lower costs for the business, less repeated effort for users.
Understanding user behavior
To better understand why users top up in small amounts, I reviewed past research and user data, and identified 3 key patterns:
Users are hesitant to keep a large balance in PayPay due to security concerns: this came up repeatedly in user interviews, suggesting that the barrier isn't just habitual, it's emotional.
The current amount input experience creates friction: usage data showed drop-offs at the input step, indicating that the UI itself was discouraging larger entries.
Many users lack visibility into their monthly PayPay spending: without a clear reference point, users default to topping up small amounts reactively as their balance runs low, rather than planning ahead.
Choosing where to start
Security concerns would need policy or comms work, not something an A/B test could easily validate. Input friction pointed to a larger redesign, with more dependencies and a longer timeline. Spending visibility was different. It was a clear before-and-after change we could ship fast and measure with a clean A/B test.
So we started there. Our core hypothesis: if users could see their last month's spending at the moment of top-up, they'd have a concrete reference point and be more likely to load a larger, more intentional amount.
Beyond the spending insight itself, we were also curious whether layout would influence behavior. We decided to test 3 variants, each presenting the information differently.
Let's begin with the top-up screen
Most users focused on the blue highlighted areas, so the variants were designed around those elements.

Ideation
Variant A - Info banner

But the problem is, it adds an extra step, users have to leave the top-up flow, check their spending, then navigate back.

Next, we needed to make it easier for users to enter that amount.

Variant B - Quick amount button

However, it didn’t work well visually, as it made the layout look off and pushed the other quick amount buttons.

Variant C - Floating button

But it made bottom bar too large and could potentially cover content at the bottom.

This gave us three testing cases to move forward with.


Revisiting the auto-fill idea
Just when things seemed to be going smoothly, an issue came up in variant A

After second thought: this felt too aggressive. Some users may prefer to enter the amount manually, but when they tapped the placeholder, we automatically filled in a value, which could lead to a poor experience over time.

This made the design less intrusive and maintained the input field as the primary focus in the information hierarchy.
Introducing the error correction button
While we’re making it easier for users to input the amount, what if they tap it by accident?
If they didn’t mean to top up that amount, they’d have to hit the delete key multiple times, which could lead to frustration.

This reduces friction for users who enter an amount manually and need to correct it quickly.
Before the rollout, it's time to look into details and edge cases.
When should we show the recommended amount?
If users see the recommendation in the middle of the month, chances are they've already topped up a small amount. At that point, they're less likely to follow our suggested amount.
To validate this, I reached out to a data team to check the average top-up frequency. The data showed that most users top up about every two weeks, meaning they visit the top-up page roughly twice a month.
So instead of displaying the suggested amount throughout the month, I decided to:
Show it at the beginning of the month, when they're more likely to make a larger top-up
Limit it to a bi-weekly display: shown once every two weeks, then hidden until the next month. This helps prevent fatigue and keeps the suggestion relevant.
What About One-Off Large Spendings?
During QA, I noticed a few users had big spikes in spending, for example investment-related payments or rare purchases. These aren't regular behaviors and could throw off the recommended amount.
To keep things accurate, we excluded certain categories from the calculation if they're clearly not part of regular monthly expenses.
Round the Amount Up — for Tech and Business Reasons
Lastly, I looked at the actual numbers. Users' monthly spending often ends in awkward figures, like 14,563. Recommending that exact amount didn't feel helpful or practical.
From both a technical and business point of view, I decided to round up to the nearest thousand. So if a user spent 14,563 last month, they'd see a suggested top-up of 15,000. It's cleaner, easier to act on, and nudges the user slightly toward a higher amount.
Cutting down to 2 variants
Testing all three at once sounded nice, but it would have meant a much bigger sample and a longer wait for results. We wanted to learn fast, so I cut Variant C and kept the two that were the most different from each other: the banner (A) and the suggestion built into what's already on the screen (B). If the way we present the number really changes behavior, these two would show it the fastest.
Each variant went out to 1% of users. Everyone else kept the standard top-up screen as the control group.
Variant A Demo
Variant B Demo
Results
Variant B won: the version built on existing components.
Top-up amount per user: +7%
Top-up frequency: -22% (from 4.5 to 3.5 times a month)
Overall top-up processing costs: -13%
Variant A, the banner, showed no significant change
The trade-off we watched
One tension sat underneath this whole project: users told us they avoid keeping a large balance because of security concerns, and our solution was nudging them to do the opposite.
So before rollout, I checked with the risk and compliance team to confirm we wouldn't push users past any regulatory balance limits or create exposure we hadn't accounted for. They confirmed the existing thresholds had enough headroom, and fraud monitoring already covered the behavior shift we expected.
After launch, we tracked support tickets related to account security. No spike. Still, this is something we'd keep watching if top-up amounts keep climbing.
Future Planning
With the results in, we're planning to roll out to all users and run another round of testing, this time focusing on the input experience.
Rolling out to all users also meant rethinking how we calculate last month's spending. Computing it live for every user wasn't realistic at our scale, so I worked with engineering on a batch calculation that updates once a day, cached and ready before users open the top-up screen.
Our hypothesis is that reducing friction in the amount input could nudge users toward larger top-ups.
Reflection
Our core hypothesis was confirmed: showing users their last month's spending at the moment of top-up does shift behavior. But the result came with an important nuance. Variant B, which surfaced the suggestion through the existing input field, drove a 7% increase in top-up amount. Variant A, the banner with an explicit CTA, showed no significant change.
The same information, presented differently, produced completely different outcomes. Users entering the top-up flow already have a number in mind. A banner at that point feels like an interruption. A suggestion inside the input field feels like a natural reference.
This points to our next hypothesis: if we surface spending context before users enter the top-up flow, when they haven't yet anchored to a number, the nudge may be more effective. We're planning to test this as the next intervention point.
Next
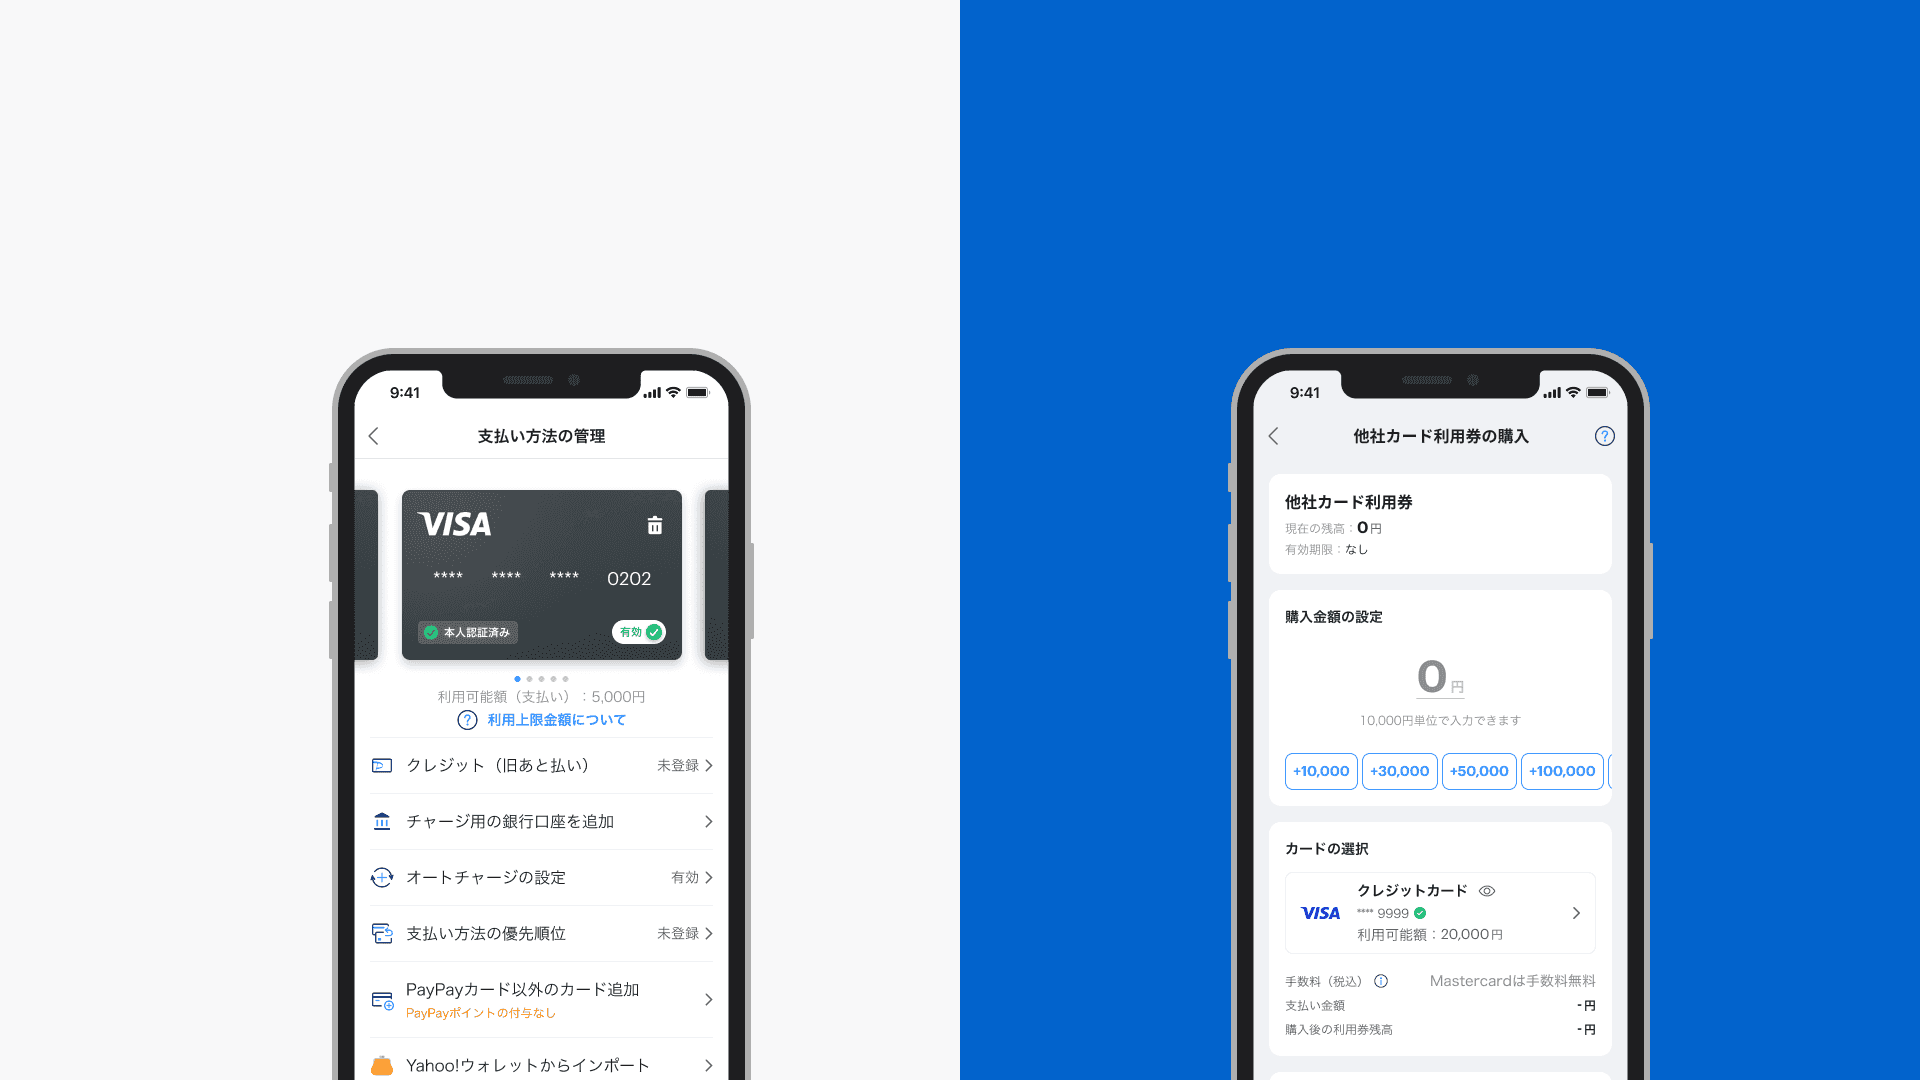
Credit Card Voucher
Designed a new payment method that shifted external credit card usage to voucher-based payments.
